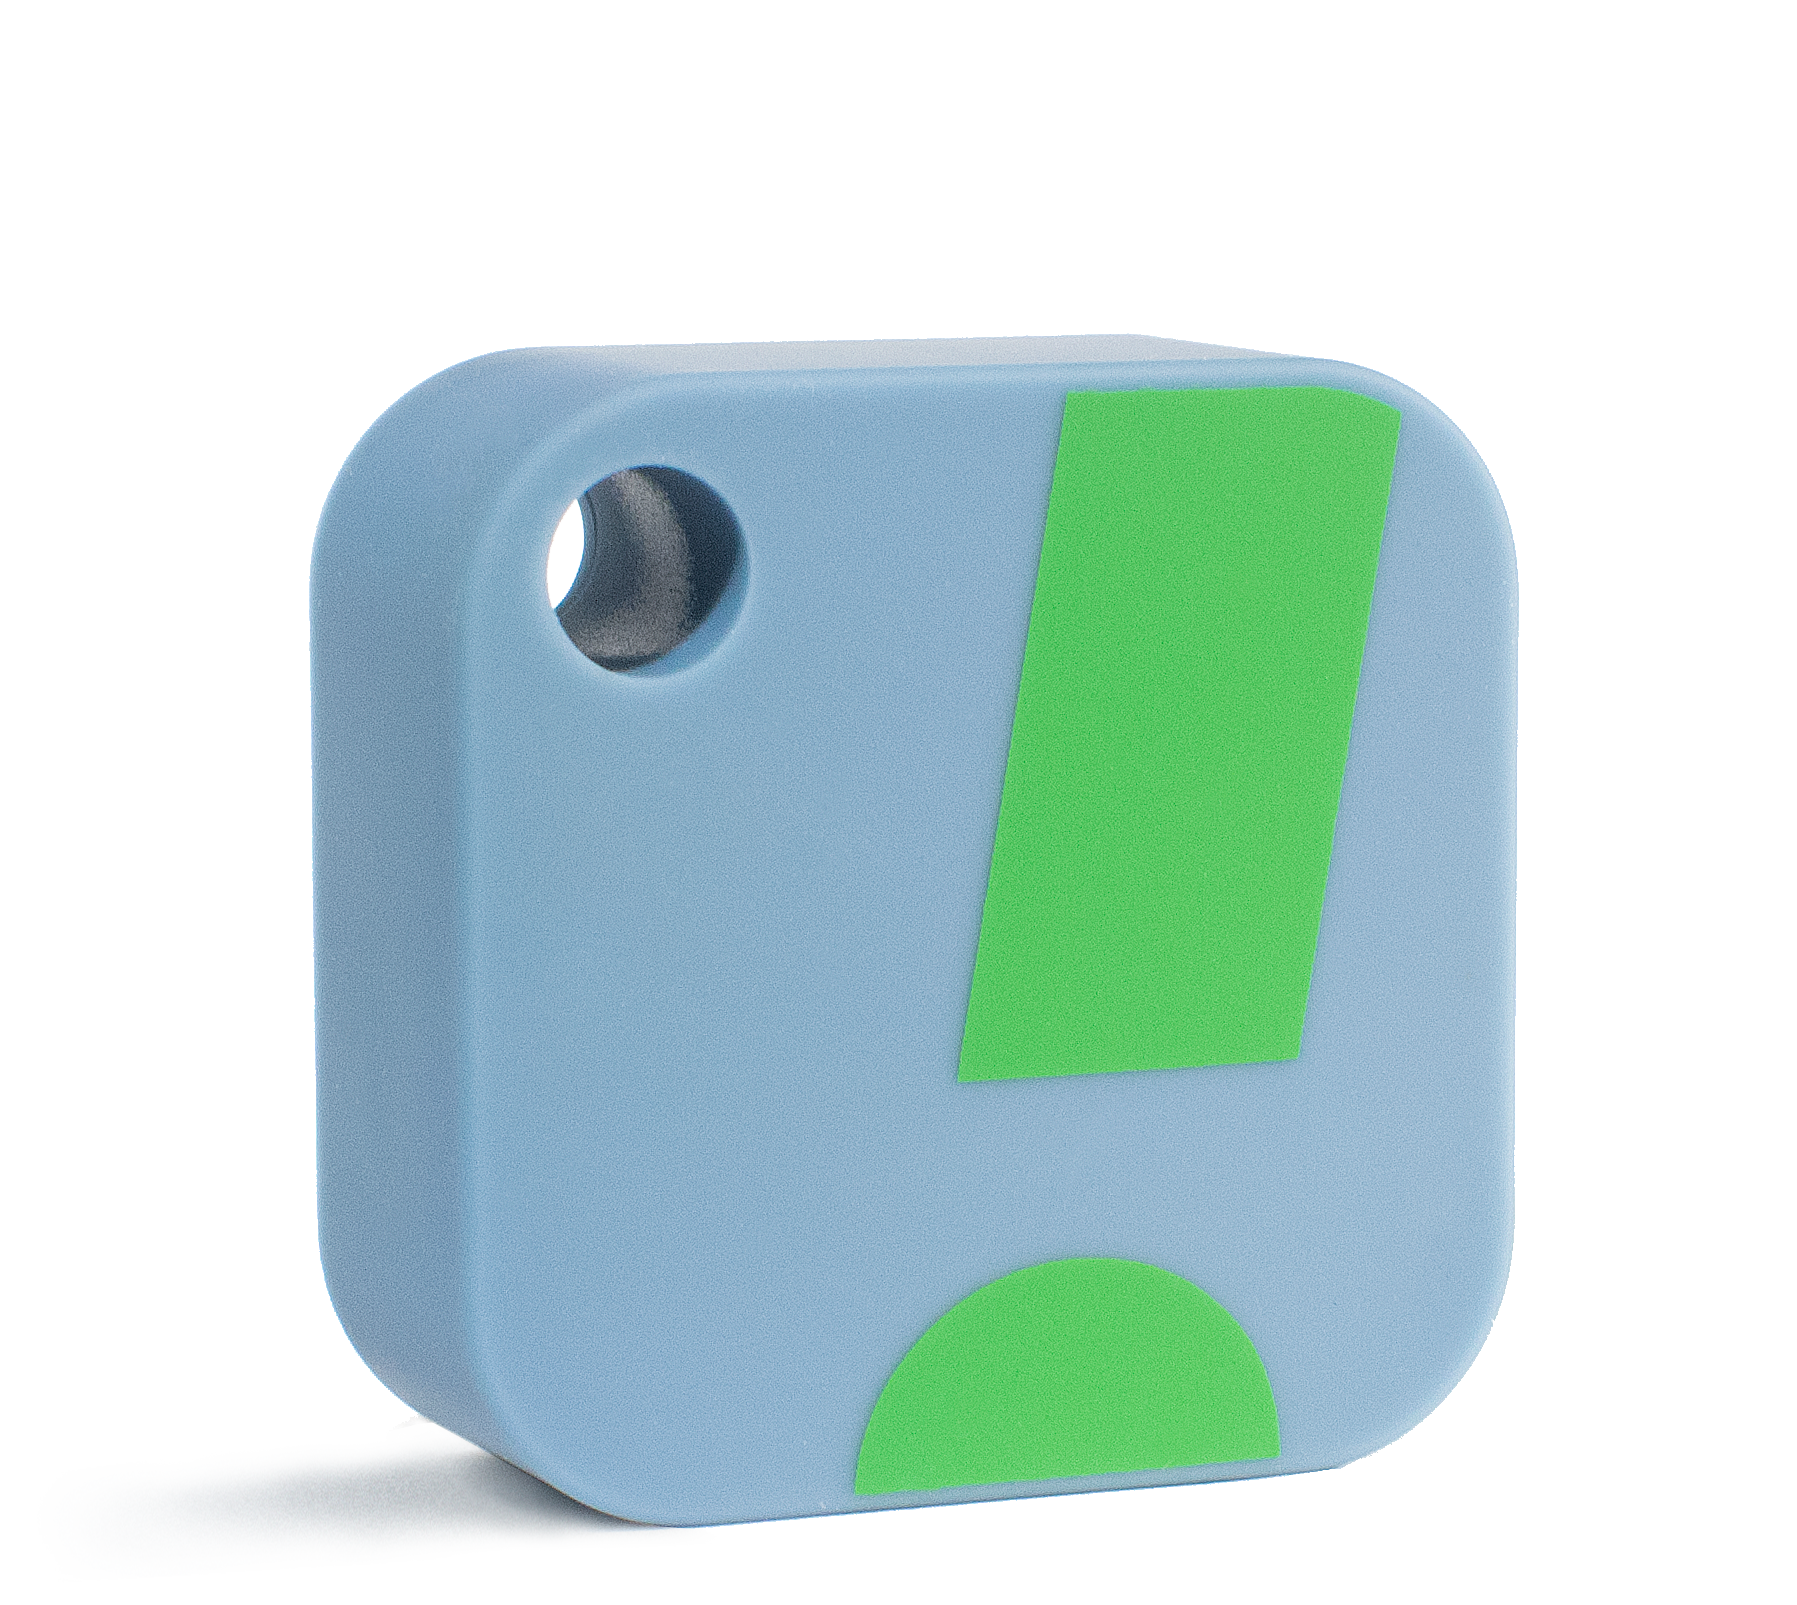
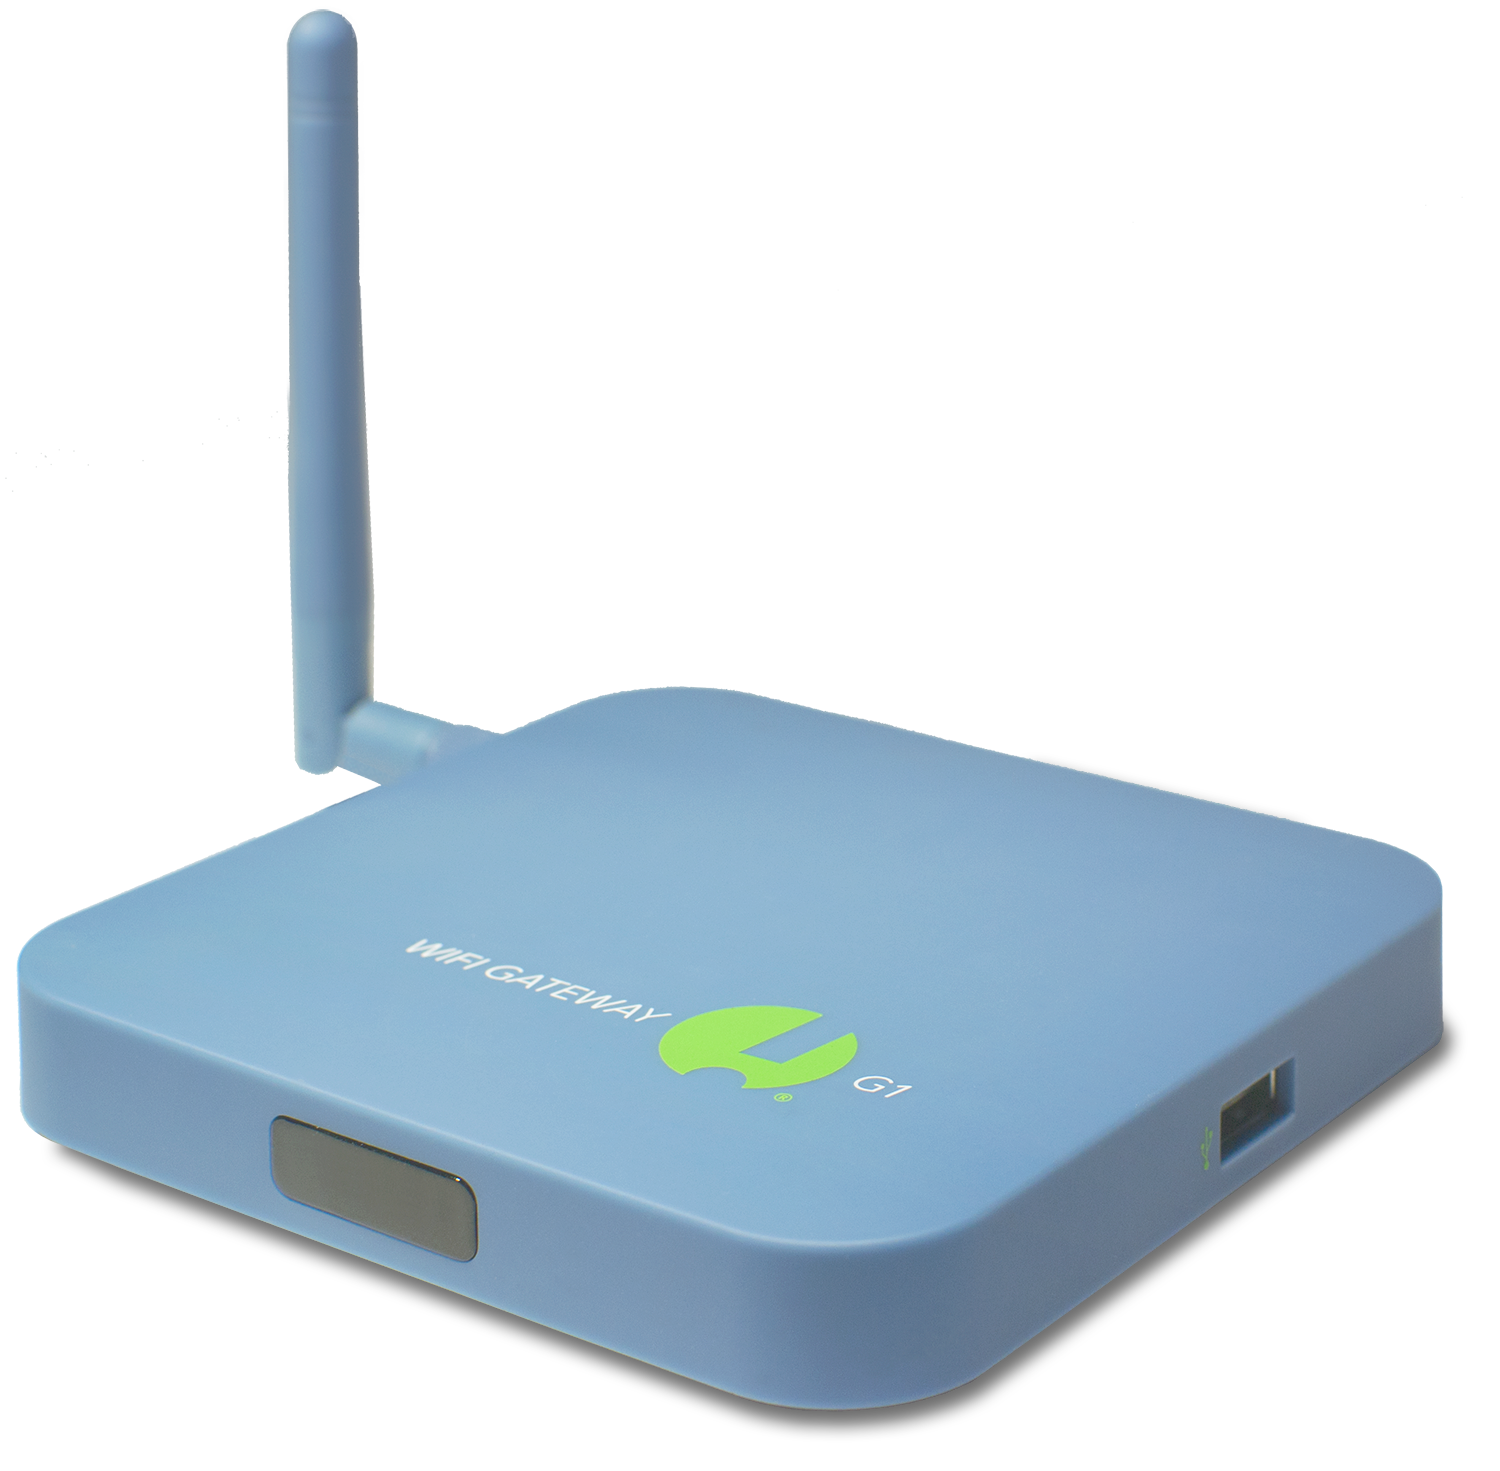
SensorPush recently introduced a API to query the temperature and humidity samples recorded by their smart sensors via G1 WIFI GATEWAY
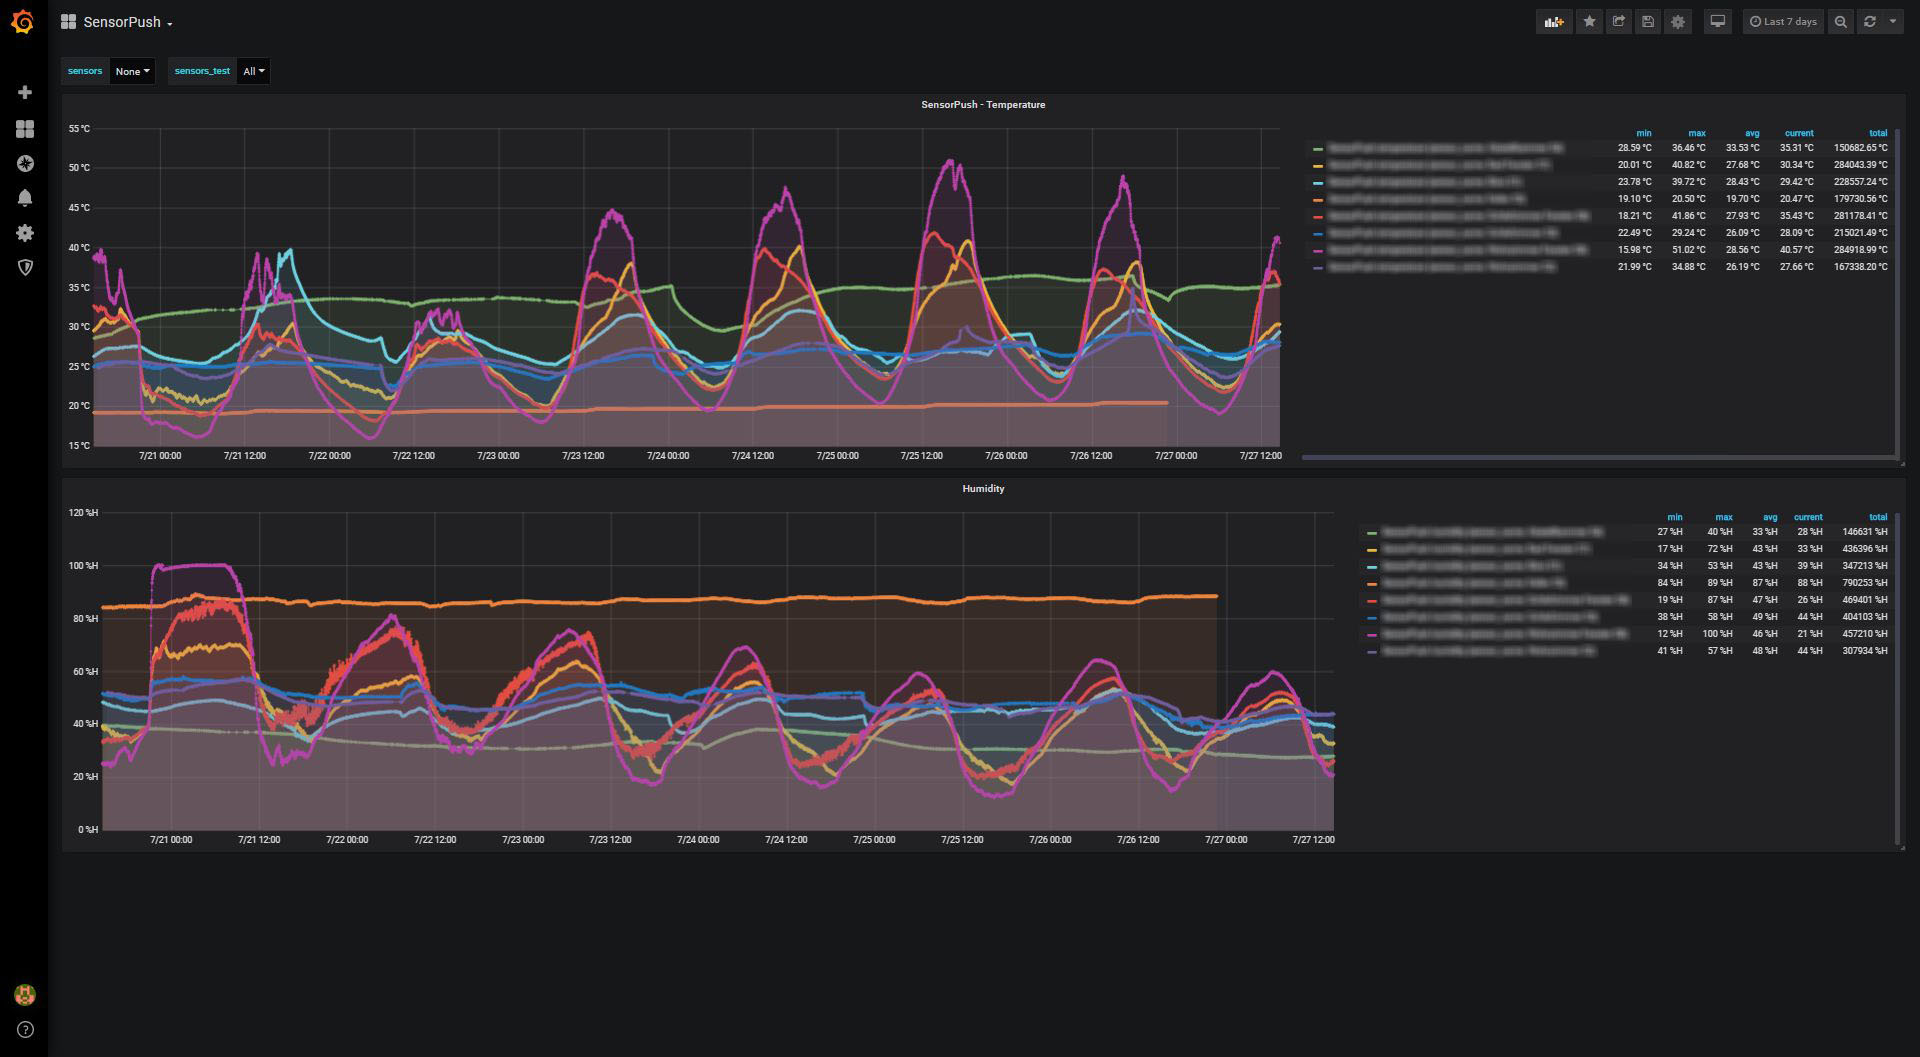
I wrote a little Python (3) tool to query the API and save the temperature and humidity time series to InfluxDB so it can be easily plotted with Grafana.
If you don't have an G1 WIFI Gateway and still want to plot your temperature, you can us another little tool I wrote to feed the CSV file which you can export via the Android App to InfluxDB.
The latest version can be found on GitHub: https://github.com/bolausson/SensorPush